
Kirsten Pagan did not always picture herself as a leader of Data Visualization at Binghamton. However, when she first became aware of the Data Visualization Interest Group (DataViz) on campus, she was excited to get involved and offer administrative support. It went along well with her role as Student Engagement Analyst within the office of SAASE (Student Affairs Assessment and Solutions for Engagement), which centered around collecting, analyzing and communicating data. Joining the group was a no-brainer, as all of these practices are core features of the data visualization process. Little did she know, five years later, she would be leading the group into a new era.

DataViz started around 2018 as a subset of the Data Science TAE (Transdisciplinary Area of Excellence). Prior to the pandemic, they worked to build up a community of practitioners across campus to network, collaborate and present their work. Data Visualization as a practice is embedded in many different fields in many forms. Bringing everyone together helped to showcase the diversity of approaches and projects. The group hosted several well-attended events as late as March 2020. However, the pandemic scattered participants and halted progress. Pagan’s original presence in the group during this time helped build the base through her experience with the B-Engaged platform. However, with the group’s break, she centered her own data visualization experience and reevaluated what DataViz could be to the Binghamton campus in the changing times.
Pagan’s connections with the university began in 2008 as a graduate student in the theatre department, a skillset that she attributes heavily to her interest in DataViz. To her, it’s not an either-or between the arts and data; it’s all interwoven into storytelling. Her work involves both her left and right brain working together to bring simple numbers to life. Data visualization is an example of an activity that achieves this synergy by organizing and presenting data with design in mind.
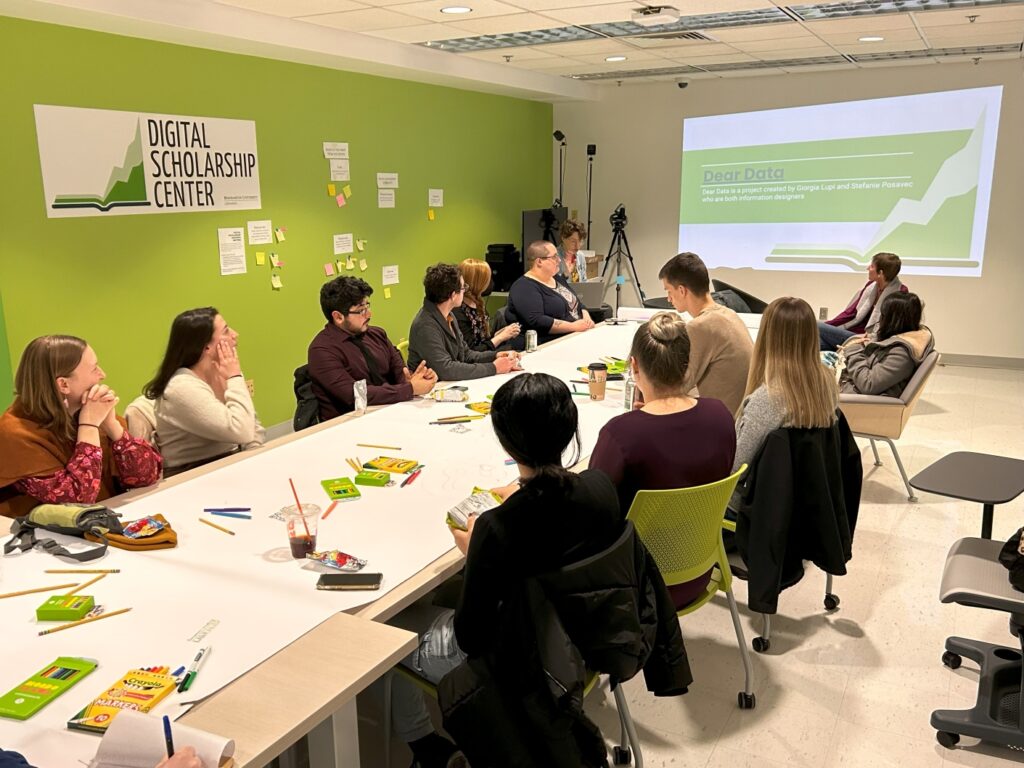
Overall, when it comes to her work, Pagan relies heavily on the concept of being a “Data Humanist,” or someone who considers visualizations artistic representations of data. This philosophy presumes that data and numbers do not reflect an intrinsic impersonality as we often assume but instead connect us to our own humanity. A famous leader in this field who inspired Pagan is Giorgia Lupi, whose manifesto for data humanism is linked above. Lupi, along with Stephanie Posavec, created Dear Data, a year-long friendship project tracking their personal data by postcard. Later published in a book, the project has been adapted as an exercise to teach people to reflect on their data practices. Binghamton has its own Dear Data group, which Pagan helps organize, that hosts events and write-ins to encourage this reflection on campus.
These kinds of projects, alongside the growth of the Digital Scholarship Center, have changed the data visualization players on campus since the original formation of DataViz. Pagan, who became the sole leader of the group in fall 2023, has taken this opportunity in stride to reevaluate the goals and vision of the group. In the past, the group existed mostly to present existing work, but she sees the charge now as attracting a wider audience ranging from people who have completed data visualization projects to those interested in learning. In fact, bringing those groups together is one of her main objectives because it’s an opportunity for new collaborations to flourish. Removing silos and creating connections for all levels of data visualization expertise is helpful to everyone and the new driving force of the group. All are invited to participate in events and hopefully grow their skills.
When asked what the practical plans are to make this happen, Pagan outlined a schedule of at least one show-and-tell event a semester. These are an opportunity for people to present and receive feedback on their work. It is also a chance for the audience to see different applications of data visualization for inspiration. This spring, the show-and-tell event will occur on Pi Day (March 14). There is currently a call out for presenters that will close on Friday, February 23, 2024. Anyone who is interested can contact the group through B-Engaged.
In fall 2023, the group also hosted their first networking event, a tradition they would like to continue. These events aim to connect faculty and staff and invite students into the fold. An ongoing collaborative relationship with Digital Scholarship librarians is also part of the plan. Together, as part of Love Data week, the two groups planned and hosted a Data Viz matchmaking event to help connect both people and tools. The growth of a community of data visualization practitioners is also part of the vision of the Digital Scholarship team, which is hosting a Data Visualization workshop series this spring every other Tuesday.
To learn more about DataViz, join the B-Engaged group. Pagan shares upcoming events and data visualization opportunities through a newsletter where information for upcoming events are posted. Happy Visualizing!
For additional information on digital scholarship and data visualization, visit digital scholarship subject guide on the Libraries’ website:
https://libraryguides.binghamton.edu/c.php?g=1304520&p=9614426