When does data become a story? For Amanda Ortiz, a PhD candidate in the History department, data becomes a story by connecting the dots between people, places and their personal histories. Ortiz studies credit transactions in colonial Latin America investigating personal relationships and social structures shape pre-banking credit networks. Ortiz hopes that by investigating credit she can uncover more about individuals’ agency and influence in their local economy including those who may otherwise be excluded from study such as enslaved persons.
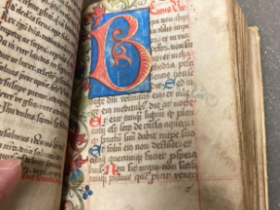
A major portion of Ortiz’s project was creating a relational database of the data she gathered across a variety of sources. Since Ortiz was tracking personal networks, collecting the data was a little more involved than looking solely at notary records. Ortiz collected information across a variety of sources including baptismal and marriage records, personal letters as well as diaries of the everyday gold mining activities, shopkeeper’s accounting books, mine owners, and records from religious leaders and the government including judicial cases and wills. As Ortiz collected more and more data she began to see the same names appear across the different sources, but connecting the dots between the individual data points was difficult.
Ortiz brought the project to the Spatial Humanities Group (SHWG) who collaboratively devised a schema for a relational database that re-organized the data into a searchable and easily editable format. Ortiz found this collaboration essential to her work and research stating that “It’s hard to do digital scholarship by yourself… it’s easier to do it in a group” and that being involved in the community “keeps you motivated, because it’s not easy” to always be learning about new tools and methods like creating a relational database.
However, once Ortiz created the database it made her research much easier to explore. Instead of scrolling through multiple tables of different documents and looking up names in each, Ortiz can simply write one query to the database to quickly pull up any documents associated with a credit lender or borrower and start to build networks of connections between them. Ortiz hopes to use the database to create a network analysis and also some maps that visualize the credit transactions being made, who had access to them, and what that means about the local economies of pre-colonial Latin America.
To read the full story by Ruth Carpenter, digital scholarship librarian, check out Digital Byte: Creating a Relational Database of Credit Transactions in Colonial Latin America on the Libraries’ blog.


